You must know that sar is a very effective tool to collect system activity or performance information from your system.
To collect all information:
sar -o test.log -A 1 3 2>&1 >/dev/null
This command will make a binary file from output, and you can display it with sadf command:
sadf -t -d test.log — -A
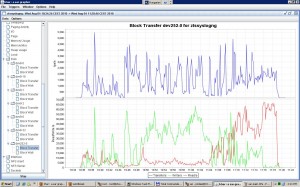
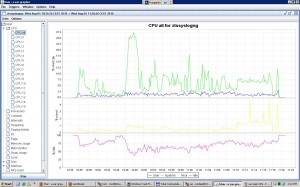
Sometimes, you would like to make graphs from these data, because diagrams are clear and better understandable than plain data.
The best way to create graphs from output of sar is kSar that is an Java-based application with gui.
You can download it from the following site: http://ksar.atomique.net/
This program can process sar text output and make diagrams from them, also it can save graphs as picture or export them into a PDF file.
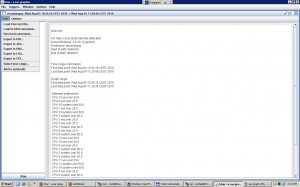
If you have only the binary output of sar, you can convert it into text file with this command:
sar -A -f test.log >> sardata.txt
Now, you can import text file into kSar, with “Data/Load from text file…” menu entry.
Also, kSar has other useful functions, like remote sar running via SSH, for more details read kSar documentation.
Loading text file: